What night-time satellite images show after the earthquakes
NASA's Black Marble images measure the light that each patch of Turkey gives off at night. Rakamlar added up that light for every province in every year, to see whether the earthquakes of February 2023 show in it. They do, but not in the way one might expect: the provinces around the epicentres grew brighter than almost any other, while Hatay, where the most lives and buildings were lost, did not stand out at all.
These figures are not published on Rakamlar as an indicator, because the national total does not mean what it seems to. It swings with the satellite and with the way its images are combined: the median province's light fell 10.6% in 2024 and rose 24.3% in 2025, swings no economy makes. So this piece compares provinces with each other within the same years, by the rank of each one's change among all 81, and never one year's total with another's.
The maps show the light those totals add up, in the year before the earthquakes and in the latest year.
The earthquake zone at night, the year before the earthquakes and the latest year
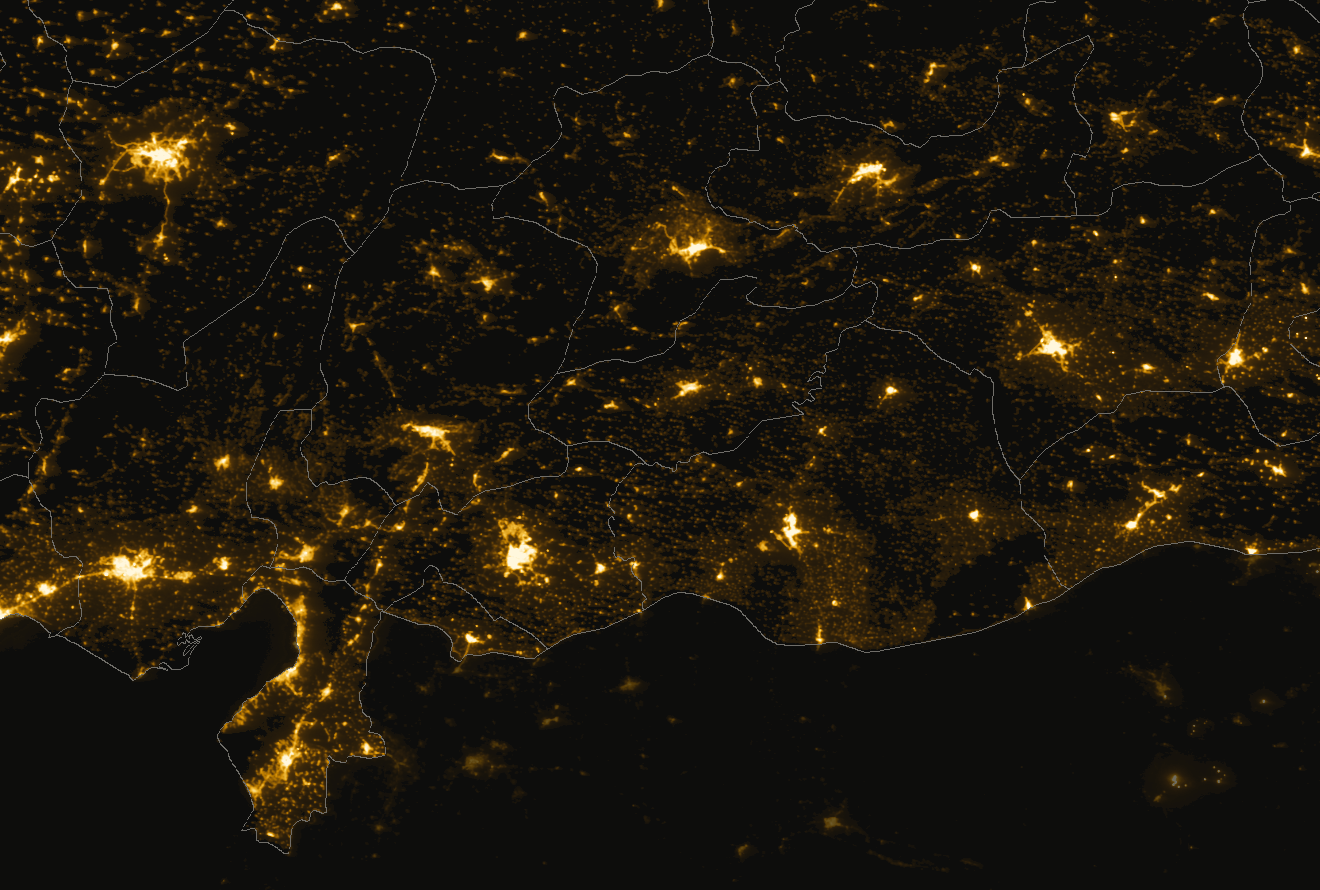
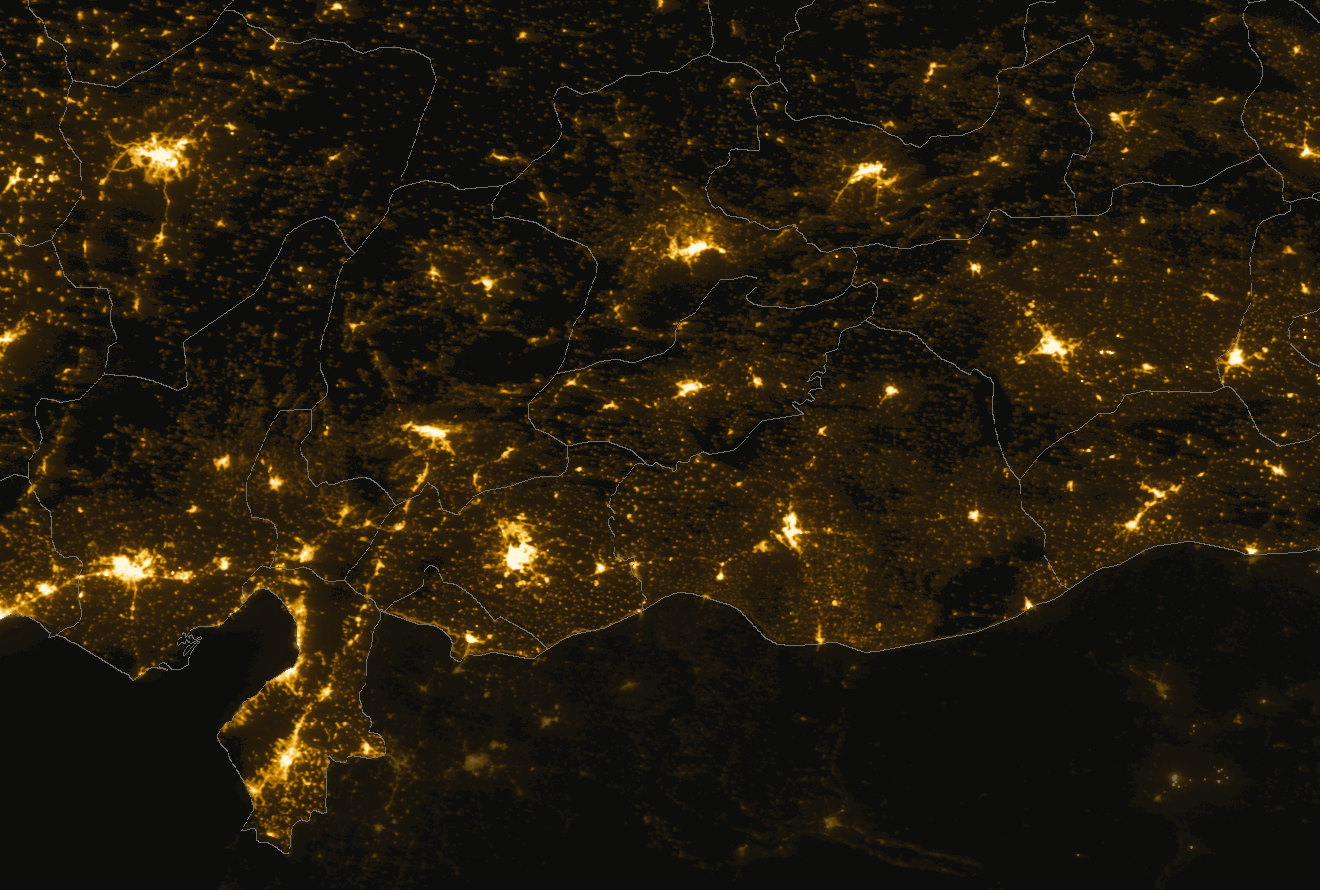
Drawn by Rakamlar from NASA Black Marble yearly composites (VNP46A4): the light the provinces' totals add up. Both years on one logarithmic brightness scale; provinces outlined in grey, neighbouring countries and the sea dimmed. The whole region looks brighter in 2025, partly because of the swing in the national total described above, so compare places with each other rather than one year's brightness with the other's.
The epicentre provinces brightened more than almost any other
From 2022, the year before the earthquakes, to 2025, Adıyaman's light rose 65.7%, the largest rise of all 81 provinces. Kahramanmaraş, where both main shocks were centred, came 5th with 52.8%, and Malatya 6th with 49.3%. The median province rose 29.5%.
This was not their habit. In the year before the earthquakes Adıyaman ranked 46th, Kahramanmaraş 47th and Malatya 75th, and the median of the eleven provinces in the earthquake zone rose 10.9%, less than the 13.1% of all provinces.
Change in night lights in the earthquake zone's provinces, and their rank of 81
| Province | 2021–2022 | 2022–2023 | 2023–2024 | 2024–2025 | 2022–2025 |
|---|---|---|---|---|---|
| Adıyaman | +12.9%46th | +26.6%6th | -2.2%13th | +33.9%19th | +65.7%1st |
| Kahramanmaraş | +12.8%47th | +18.6%21st | -2.8%15th | +32.5%21st | +52.8%5th |
| Malatya | +7.8%75th | +8.5%73rd | +2.2%5th | +34.7%17th | +49.3%6th |
| Kilis | +11.3%59th | +17.0%31st | +1.3%7th | +21.8%47th | +44.3%13th |
| Diyarbakır | +10.2%68th | +12.7%53rd | -13.3%56th | +41.3%10th | +38.0%20th |
| Elazığ | +15.1%25th | +9.3%72nd | -7.3%29th | +31.4%25th | +33.2%29th |
| Şanlıurfa | +10.9%64th | +13.2%51st | -15.1%63rd | +37.9%14th | +32.7%31st |
| Hatay | +6.7%76th | +6.5%76th | +8.4%1st | +13.0%72nd | +30.5%38th |
| Gaziantep | +9.7%70th | +10.1%66th | +0.3%8th | +17.2%54th | +29.5%41st |
| Osmaniye | +13.5%39th | +13.5%46th | -6.0%26th | +16.0%60th | +23.7%56th |
| Adana | +10.3%66th | +12.4%54th | -4.3%20th | +14.9%63rd | +23.5%57th |
| Earthquake zone, median | +10.9% | +12.7% | -2.8% | +31.4% | +33.2% |
| All provinces, median | +13.1% | +14.3% | -10.6% | +24.3% | +29.5% |
Change in the sum of the light each province gave off over a year; rank 1 is the largest rise. Calculated by Rakamlar from NASA Black Marble yearly composites (VNP46A4). The national total swings with the satellite and the way images are combined, so compare provinces with each other within a year, not years with each other.
Hatay did not go dark
Hatay's light rose 6.5% in the year of the earthquakes, which ranked it 76th, the same place as the year before (76th). In 2024 it rose more than any other province, and since 2022 it ranks 38th, close to the middle.
A yearly image cannot separate the light that went out in collapsed neighbourhoods from the light that came on elsewhere: container and tent cities, floodlit demolition and building sites, generators, and new housing on the edges of towns. The totals show only the balance of the two. Relief and rebuilding are a likely reason the epicentre provinces brightened, but these images cannot prove it.
NASA's own daily images of Antakya show what a yearly total smooths over. Two days after the earthquakes most of the city and the towns around it were dark; by the end of April their lights had largely come back. A year's composite averages over both, and over the months that followed.
Antakya at night: two days before the earthquakes, two days after, and nearly three months after
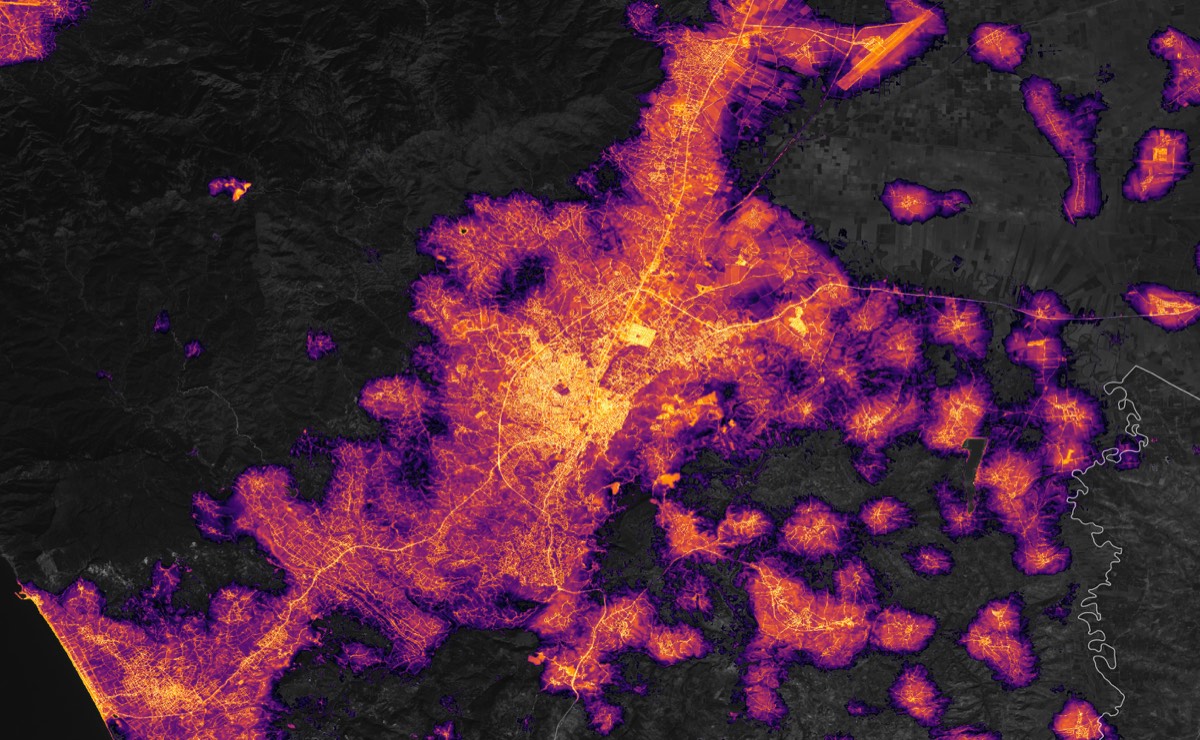
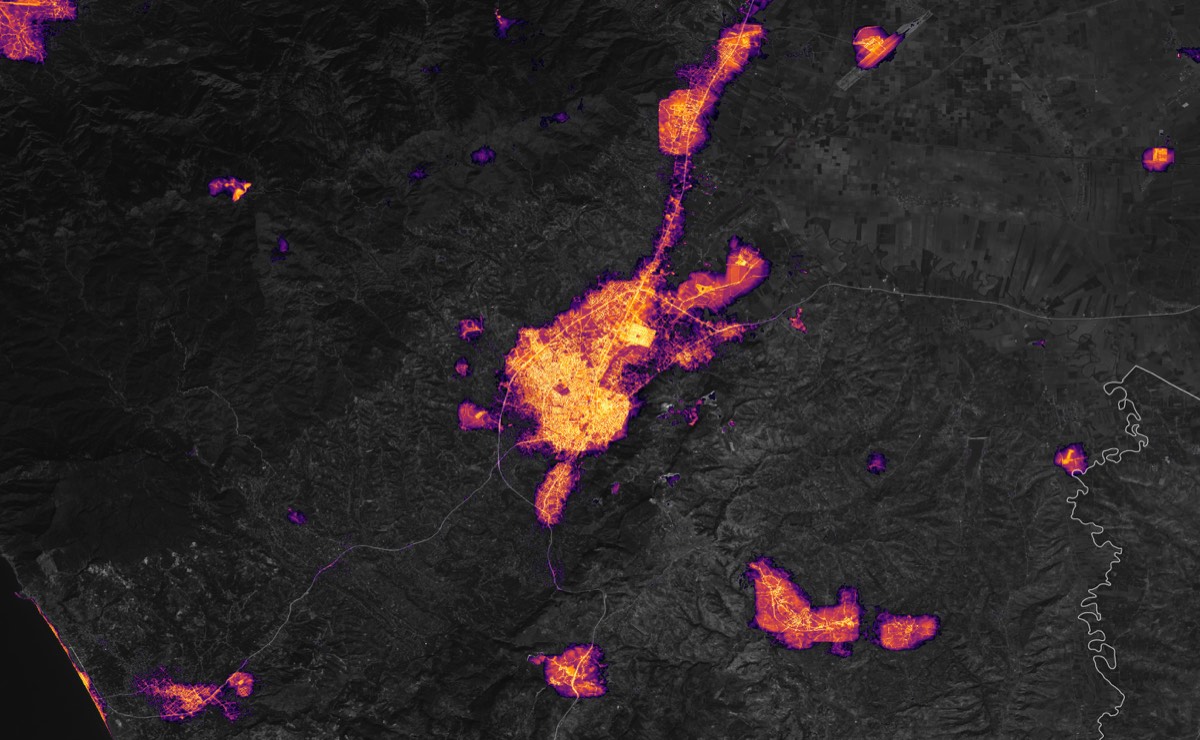
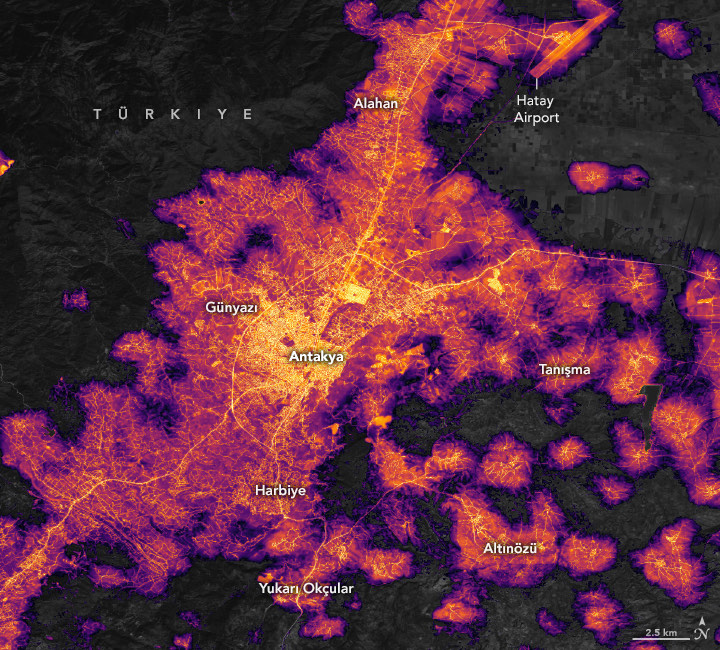
NASA Earth Observatory images by Lauren Dauphin, using Black Marble data courtesy of Ranjay Shrestha/NASA Goddard Space Flight Center, Landsat data from the U.S. Geological Survey and data from OpenStreetMap (© OpenStreetMap contributors). From NASA's daily Black Marble product, not on the scale of the yearly composites above; the April image shows a wider area.
Provinces that grew before mostly grew after
Growth in light carries over from one span of years to the next. Across provinces, the change in the three years before the earthquakes and in the three after have a rank correlation of 0.35, about the same as between the two three-year spans before them (0.32). Adıyaman, Kahramanmaraş and Malatya lie well above that pattern: they grew faster after the earthquakes than the provinces that had grown as much as they did before.
Change in night lights, the three years before and after the earthquakes
Coefficient 0.3581 provinces, 2019–2022 / 2022–2025
Change, 2022–2025
Change, 2019–2022
All values as a table
| Province | Change, 2019–2022 | Change, 2022–2025 |
|---|---|---|
| Adana | 22.8% | 23.5% |
| Adıyaman | 27.7% | 65.7% |
| Afyonkarahisar | 37.8% | 22.4% |
| Ağrı | 17.3% | 41.1% |
| Amasya | 20.2% | 31.8% |
| Ankara | 11.1% | 21.3% |
| Antalya | 26.9% | 24.7% |
| Artvin | 24.4% | 16.9% |
| Aydın | 23.2% | 18.5% |
| Balıkesir | 29.9% | 24.1% |
| Bilecik | 37.9% | 30.7% |
| Bingöl | 47.6% | 47.9% |
| Bitlis | 33.5% | 49.1% |
| Bolu | 33.2% | 36.1% |
| Burdur | 32.5% | 38.0% |
| Bursa | 20.6% | 16.9% |
| Çanakkale | 42.0% | 25.8% |
| Çankırı | 32.0% | 30.7% |
| Çorum | 15.9% | 42.2% |
| Denizli | 18.0% | 20.1% |
| Diyarbakır | 30.8% | 38.0% |
| Edirne | 38.0% | 24.2% |
| Elazığ | 36.2% | 33.2% |
| Erzincan | 24.2% | 25.2% |
| Erzurum | 13.3% | 29.4% |
| Eskişehir | 19.5% | 26.1% |
| Gaziantep | 28.0% | 29.5% |
| Giresun | 33.9% | 20.5% |
| Gümüşhane | 43.1% | 37.0% |
| Hakkâri | 42.8% | 53.3% |
| Hatay | 27.0% | 30.5% |
| Isparta | 22.4% | 27.1% |
| Mersin | 26.3% | 21.5% |
| Istanbul | 3.3% | 5.9% |
| İzmir | 13.9% | 9.4% |
| Kars | 34.6% | 41.1% |
| Kastamonu | 29.2% | 33.0% |
| Kayseri | 22.2% | 25.1% |
| Kırklareli | 31.0% | 18.7% |
| Kırşehir | 40.8% | 42.9% |
| Kocaeli | 12.1% | 22.2% |
| Konya | 32.3% | 36.2% |
| Kütahya | 39.3% | 27.7% |
| Malatya | 24.1% | 49.3% |
| Manisa | 21.0% | 17.9% |
| Kahramanmaraş | 24.1% | 52.8% |
| Mardin | 46.6% | 19.8% |
| Muğla | 20.9% | 18.3% |
| Muş | 43.0% | 58.0% |
| Nevşehir | 25.7% | 32.3% |
| Niğde | 35.3% | 35.2% |
| Ordu | 42.5% | 25.1% |
| Rize | 23.8% | 13.0% |
| Sakarya | 21.2% | 30.3% |
| Samsun | 18.4% | 27.6% |
| Siirt | 31.4% | 40.1% |
| Sinop | 31.0% | 45.2% |
| Sivas | 23.4% | 35.2% |
| Tekirdağ | 36.2% | 17.4% |
| Tokat | 17.7% | 31.9% |
| Trabzon | 27.6% | 19.8% |
| Tunceli | 27.4% | 58.7% |
| Şanlıurfa | 39.1% | 32.7% |
| Uşak | 28.4% | 18.0% |
| Van | 31.8% | 32.3% |
| Yozgat | 15.5% | 44.5% |
| Zonguldak | 18.5% | 11.5% |
| Aksaray | 52.9% | 44.6% |
| Bayburt | 27.5% | 24.7% |
| Karaman | 31.8% | 45.4% |
| Kırıkkale | 20.6% | 36.7% |
| Batman | 30.9% | 30.0% |
| Şırnak | 49.7% | 35.8% |
| Bartın | 19.8% | 16.1% |
| Ardahan | 47.2% | 23.2% |
| Iğdır | 31.2% | 37.4% |
| Yalova | 21.8% | 22.4% |
| Karabük | 18.4% | 22.5% |
| Kilis | 43.2% | 44.3% |
| Osmaniye | 30.8% | 23.7% |
| Düzce | 19.0% | 26.6% |
Each dot is a province. Horizontal axis 2019–2022, vertical axis 2022–2025. Calculated by Rakamlar from NASA Black Marble yearly composites (VNP46A4).
What to discount
Istanbul's light barely moves: 5.9% since 2022, last of 81. One known reason is the switch to LED street lighting. The satellite's sensor sees little of the blue light that LEDs give off, so a city that changes its lamps looks dimmer than it is, and the largest cities have the most lamps to change. The same effect can dim any province, which is one more reason to read these ranks as a sign rather than a measurement.
Rakamlar also tried the monthly images. In winter much of each monthly image is filled in from earlier observations under snow and cloud, and the swings they show are larger still. Even the summer months, which need no filling, did not show Hatay's losses.